
Maps
Trip Production and Attraction, Gazipur City Corporation
These maps present zonal trip production and attraction patterns for Gazipur City Corporation, derived from the trip generation step of the four-step travel demand model developed under the Gazipur Comprehensive Transport Masterplan. Production denotes trips originating from each zone, while attraction represents trips drawn to it, together forming the foundational input for subsequent distribution, mode choice, and assignment modelling stages.
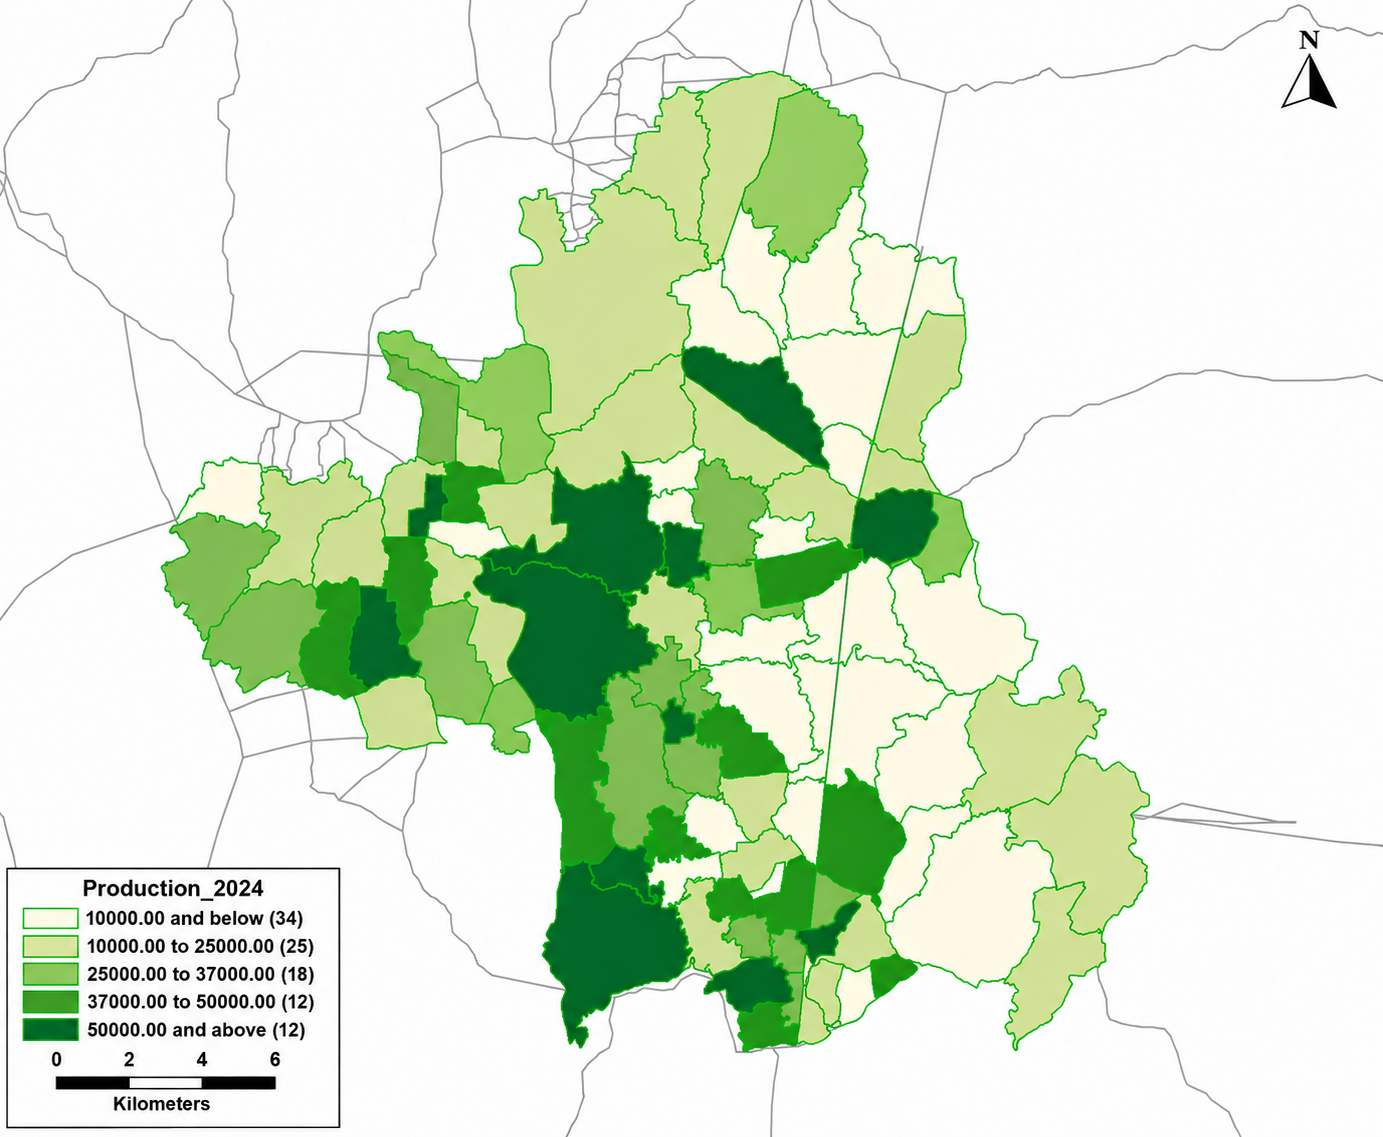
Trip production by zone, base year.
Trip Desire Lines, Gazipur City Corporation
Desire lines from the gravity model developed for the Gazipur Comprehensive Transport Masterplan, produced within a four-step travel demand framework. Each line shows the straight-line demand between two zones, indicating where trips want to go. Width and colour are scaled to trip volume.
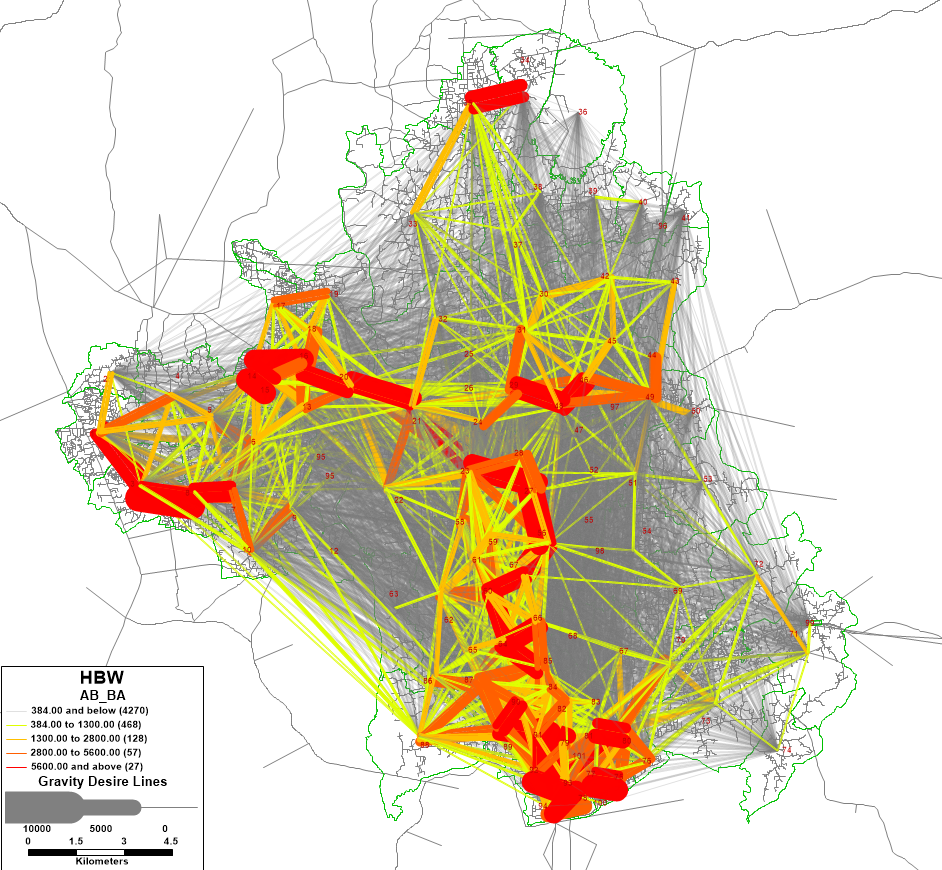
Home-based work desire lines, base year.
HBW: home-based work | HBE: home-based education | HBO: home-based other | NHB: non-home-based
Each map is classified on its own volume range, so line widths are not directly comparable across years. Legend values give the actual volumes.
Trip Length Distribution, Gazipur City Corporation
Spatial distribution of trip lengths by purpose and forecast year, produced from the distribution step of the four-step travel demand model. Trips are expressed in number of trips, and travel time intervals in minutes. The pattern reflects how far trips travel from each zone, varying by purpose according to the deterrence function applied in the gravity model.
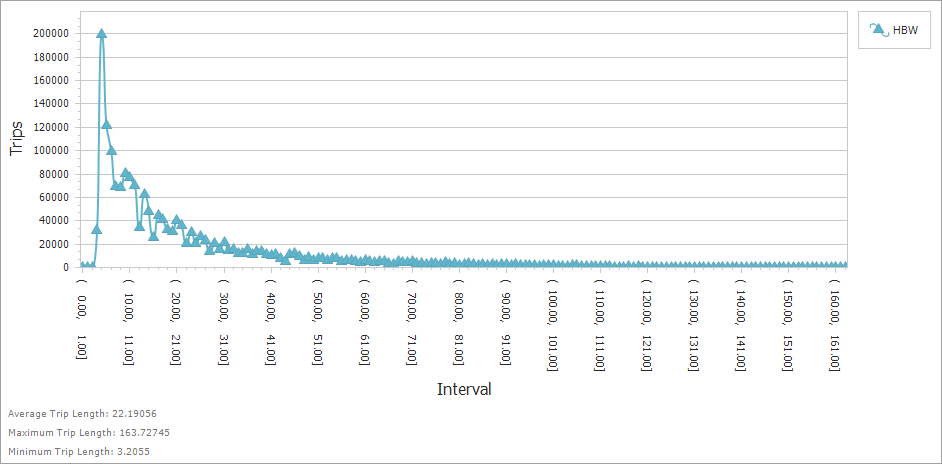
Home-based work trip length distribution, base year.
HBW: home-based work | HBE: home-based education | HBO: home-based other | NHB: non-home-based
Highway Assignment, Gazipur City Corporation
Assigned link volumes from the traffic assignment step of the four-step travel demand model. Forecast years are presented under three scenarios: Do Nothing, retaining the existing network without any intervention; Business as Usual, reflecting committed schemes already in the pipeline; and Masterplan, incorporating the full set of proposed network and demand management measures.
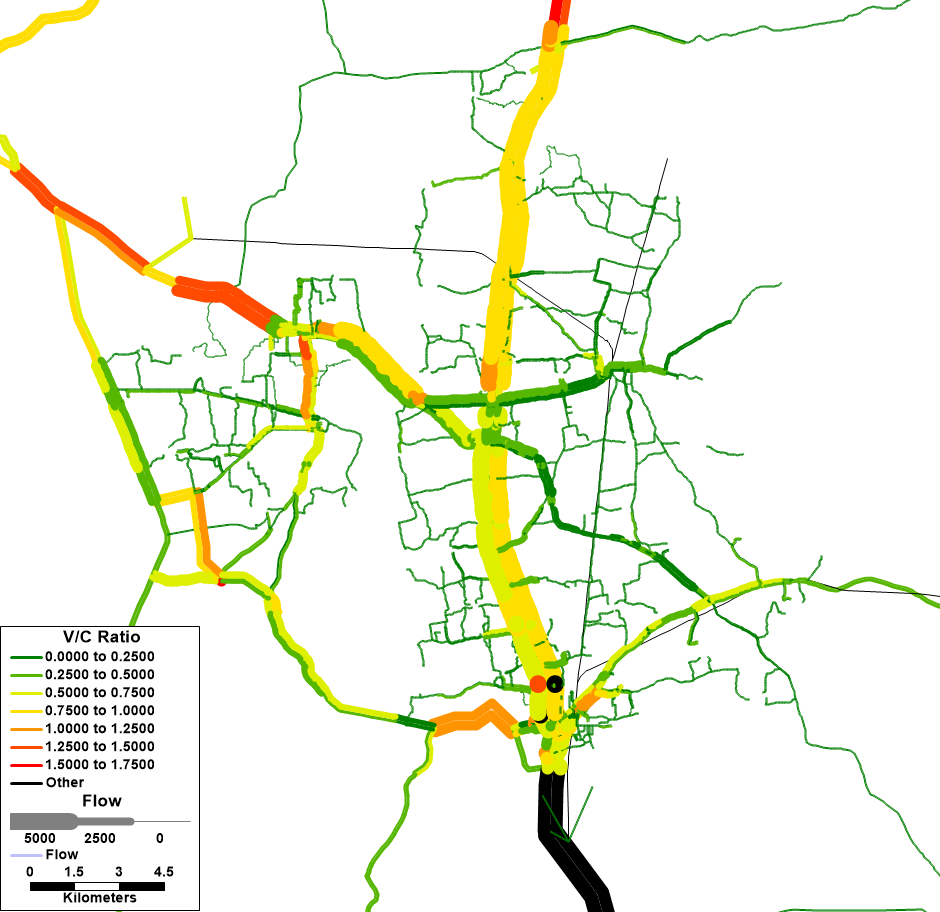
Assigned link volumes, base year.
Road Crash Density, Gazipur City Corporation
Animated mapping of 327 road crashes across Gazipur City Corporation Area, playing year by year. The density surface is weighted by severity, with fatal crashes carrying five times the influence of a damage-only collision. The colour scale is held fixed across all years, so intensity is comparable between frames rather than rescaled within each one. Dashed circles mark the five highest-concentration locations identified by Density-Based Spatial Clustering of Applications with Noise (DBSCAN) at a 500 m threshold: Board Bazar, Vogra, Tongi, Salna and Konabari. These clusters are derived from the full study period, not individual years, so their positions and crash counts remain constant as the animation plays.
Severity-weighted crash density by year, [2020]–[2024].
Built in Python with pandas, scikit-learn and folium. | Open full size | View Source Code
Nighttime Light Expansion, Bangladesh 2013–2024
Annual composites of VIIRS Day/Night Band imagery, showing observed nighttime radiance across Bangladesh from 2013 to 2024. Monthly cloud-free composites were reduced to an annual median per pixel and clipped to the national boundary, with the radiance stretch held fixed across every frame so that years are directly comparable. Mean radiance rose nationally from about 0.19 to 0.80 nW/cm²/sr over the period, concentrating around Dhaka and the Dhaka–Chattogram corridor while filling in across the western and northern districts.
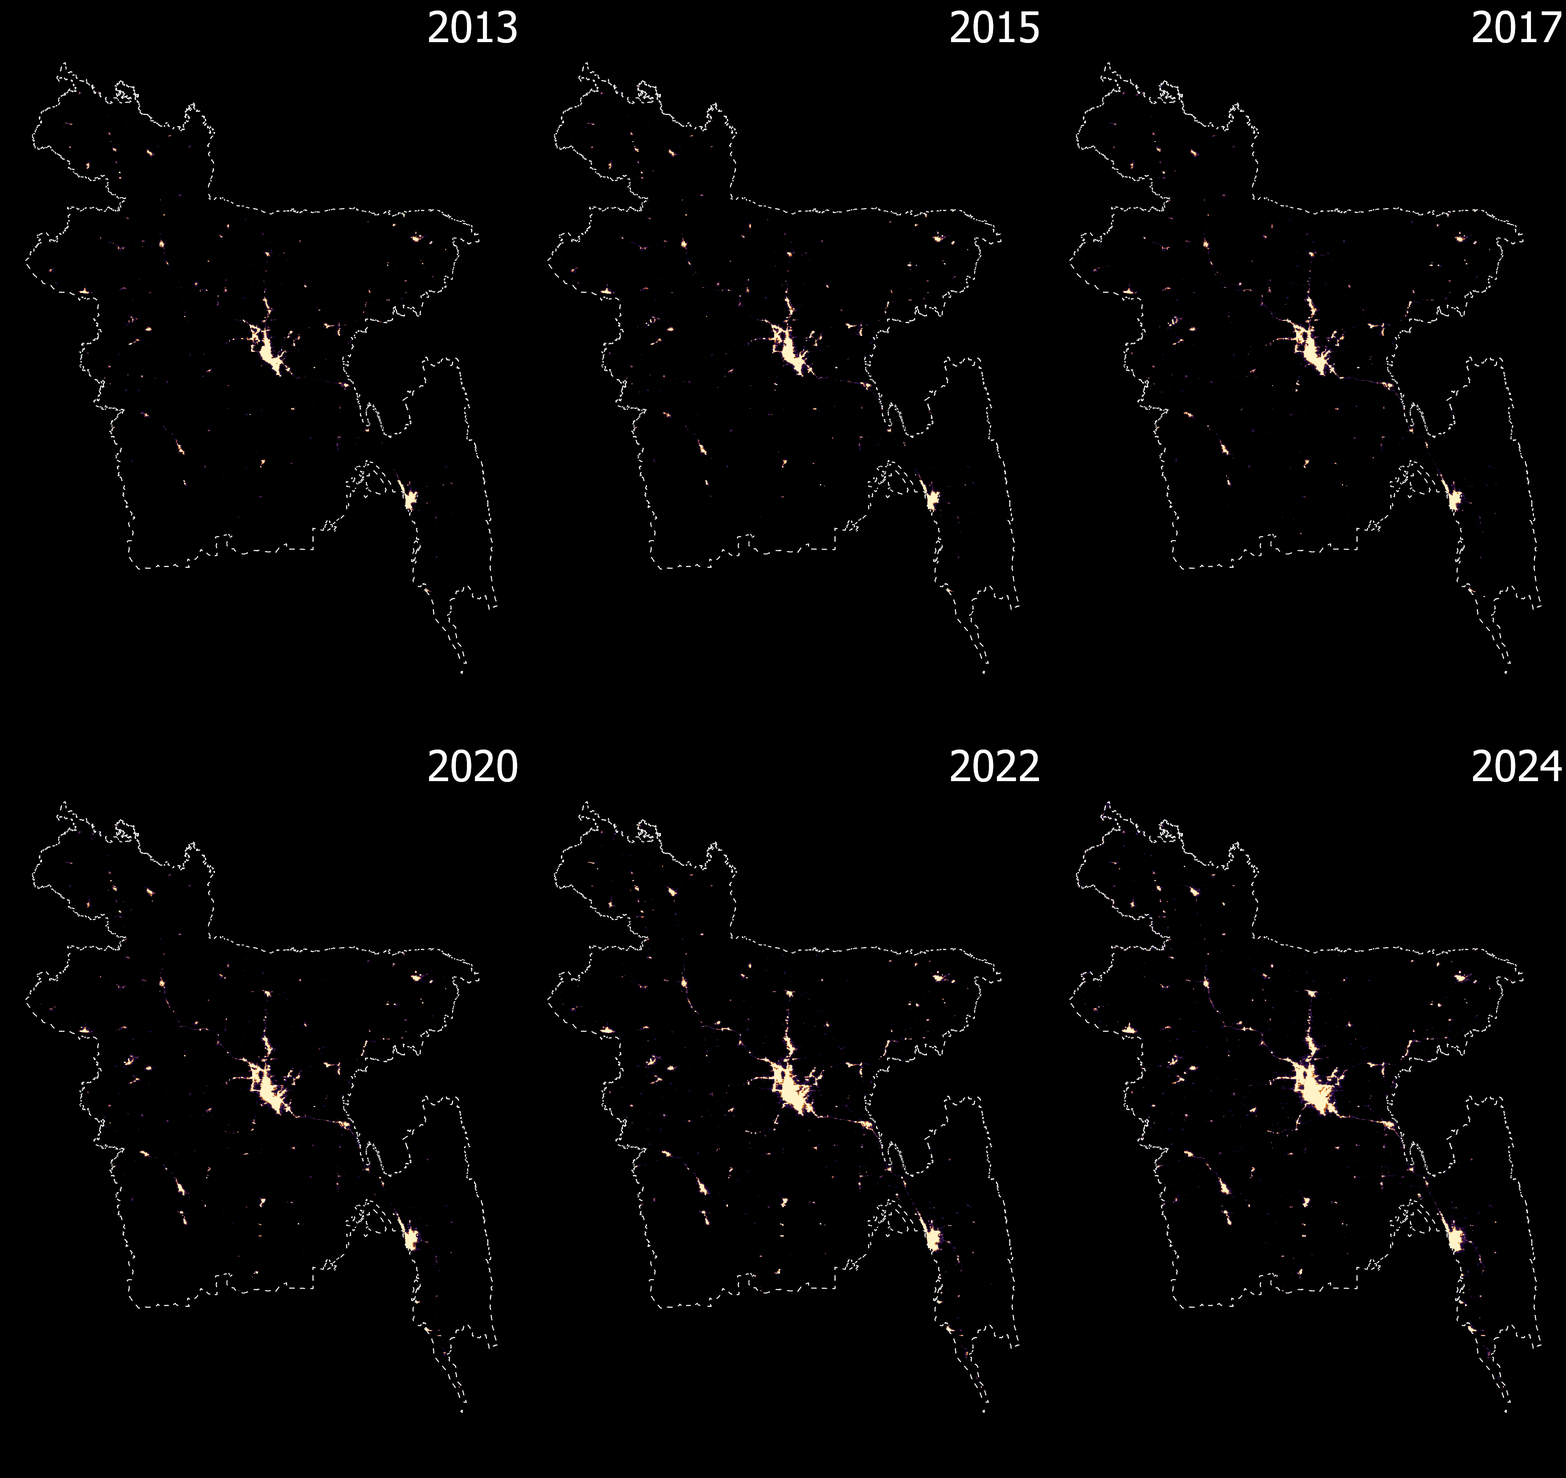
Annual median nighttime radiance, 2013–2024.
Processed in Google Earth Engine; cartography and frame export in ArcGIS Pro via arcpy. | Data: Earth Observation Group
Bus Route Overlap, Dhaka City
Route overlap across the 98 active bus routes operating in Dhaka. Each corridor is weighted by the number of routes running along it, with line width scaled to that count. Route alignments were digitised from the published network and simplified into 222 corridor segments, so that each stretch of road carries a single readable value rather than a count that changes block by block. The busiest corridor carries 26 of the 98 routes, concentrated on the north–south spine through Gulistan and Sayedabad, while much of the network beyond it is served by four routes or fewer. The animated view builds the network up one class at a time, showing how little of the city is reached before the heaviest corridors appear.
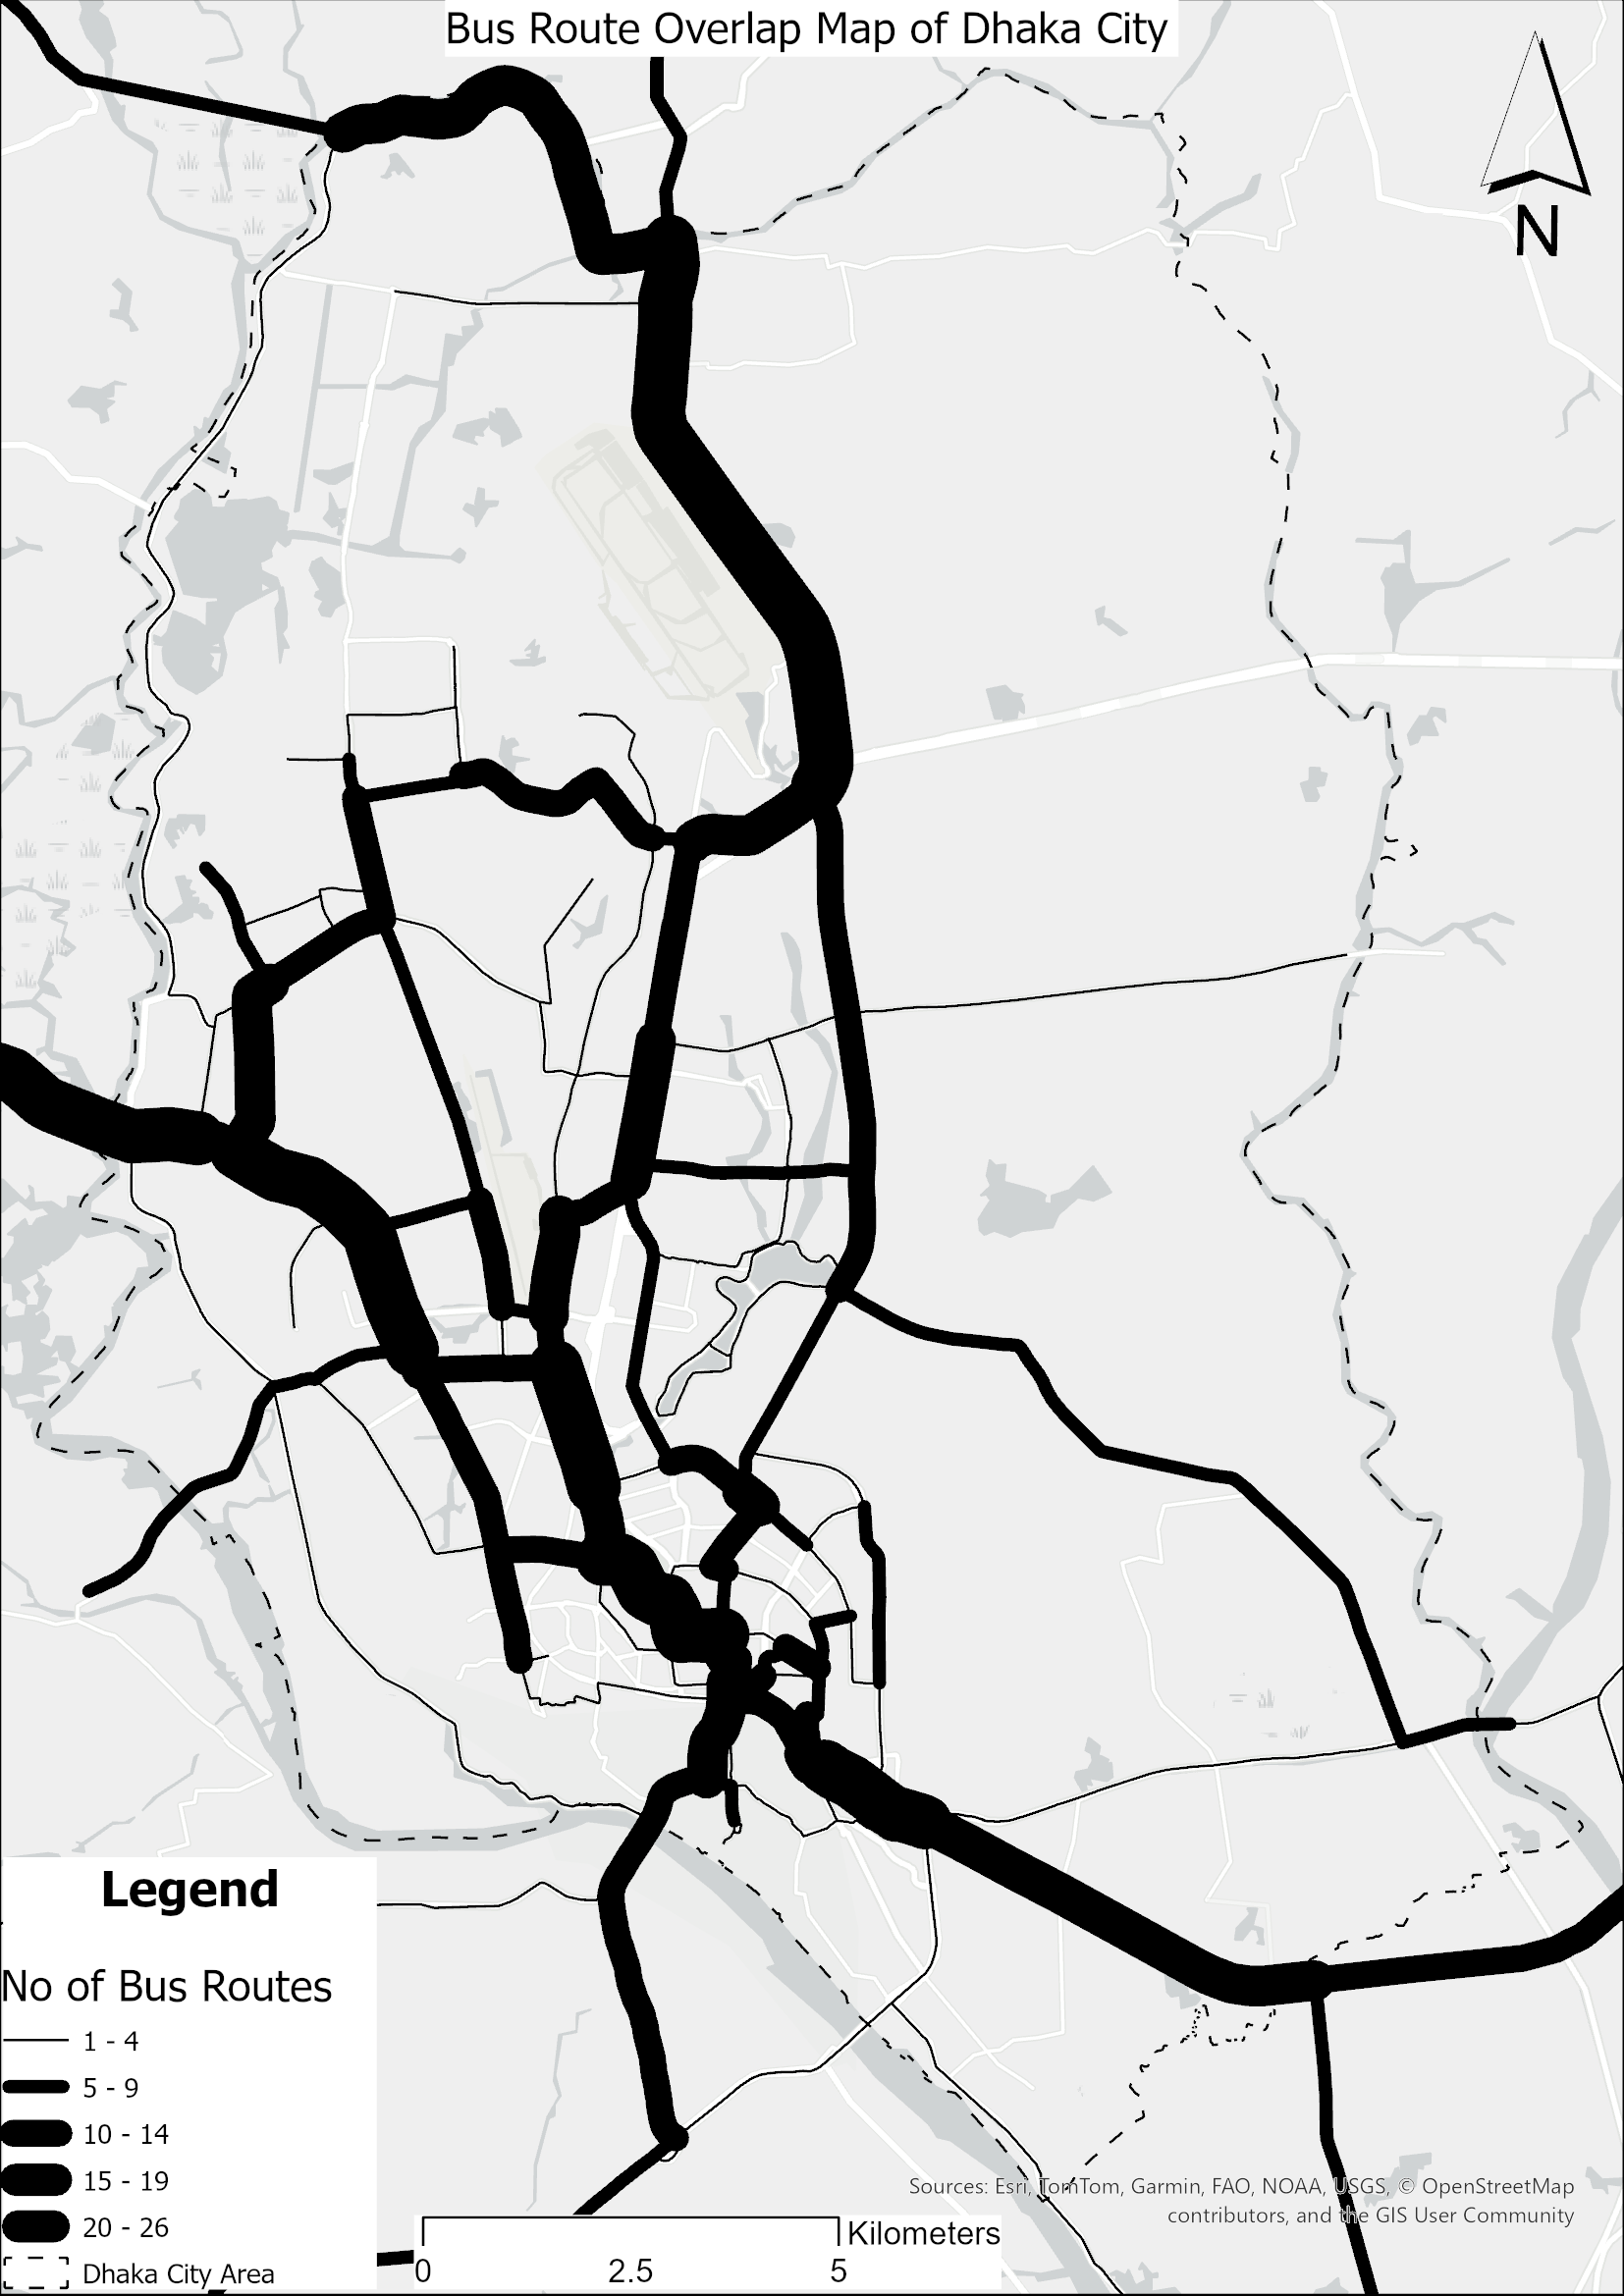
Number of bus routes per corridor, all classes.
Routes digitised in Google Earth; corridor network drawn and analysed in ArcGIS Pro, animation frames exported via arcpy and assembled in Python.
Intersection Design, Dhaka South City Corporation
Conceptual intersection layouts prepared for locations across Dhaka South City Corporation. Each design responds to observed turning movements, pedestrian demand and capacity constraints at the site, developed in Civil 3D alongside traffic, delay and parking survey analysis.
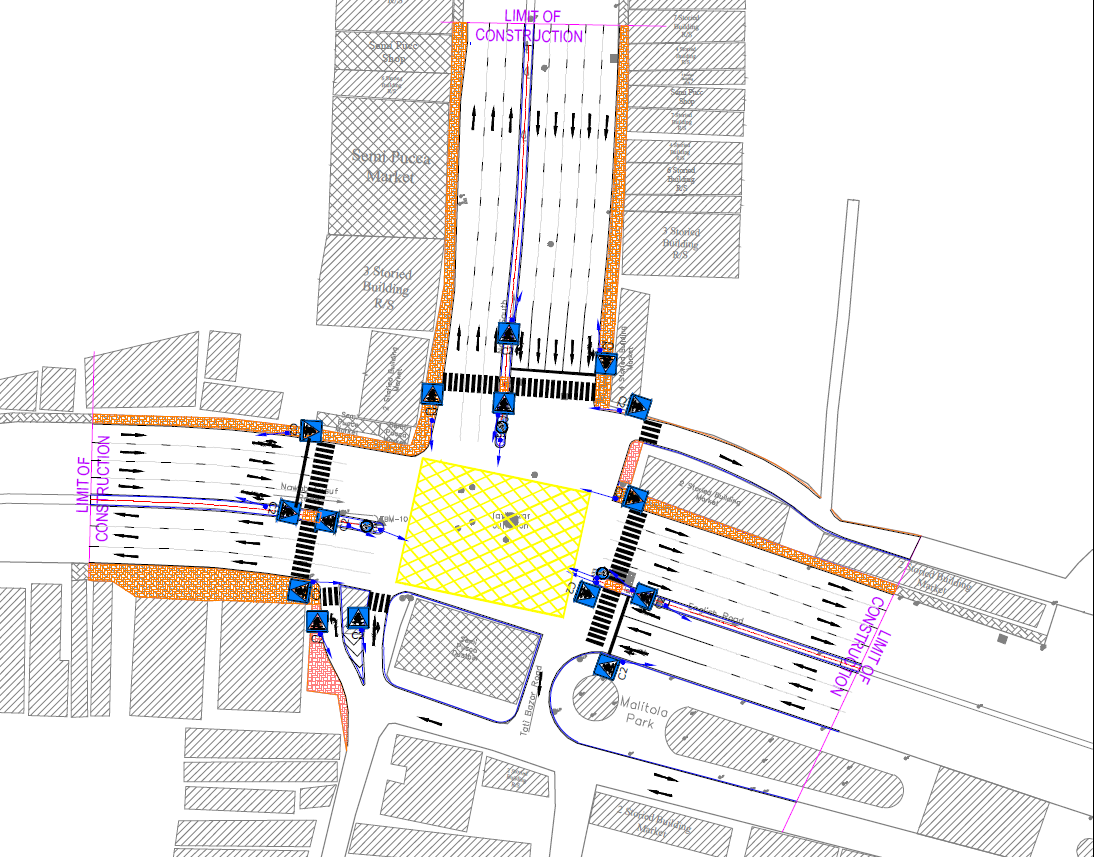
Tati Bazar intersection, conceptual design.